Analytics
Risk-adjusted performance and diagnostic charts.
Performance analytics focus on return per unit of risk, drawdown structure, and consistency across months.
Total Return
+148.8%
Annual Return
+18.8%
Annual Volatility
11.2%
Sharpe Ratio
1.67
Max Drawdown
-11.3%
Calmar Ratio
1.66
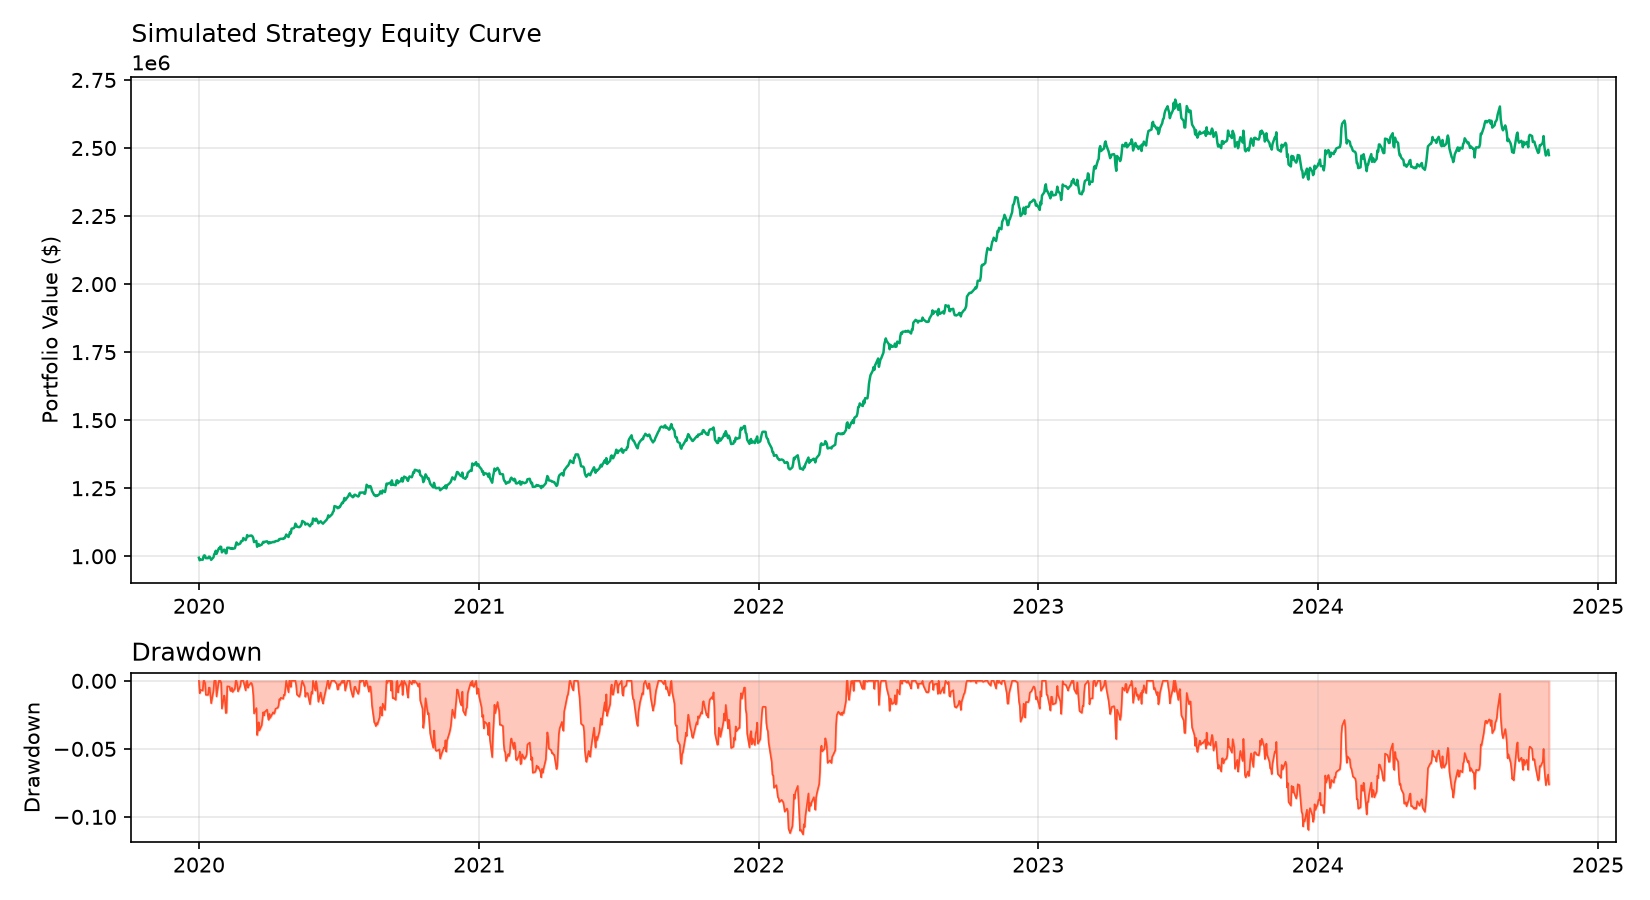
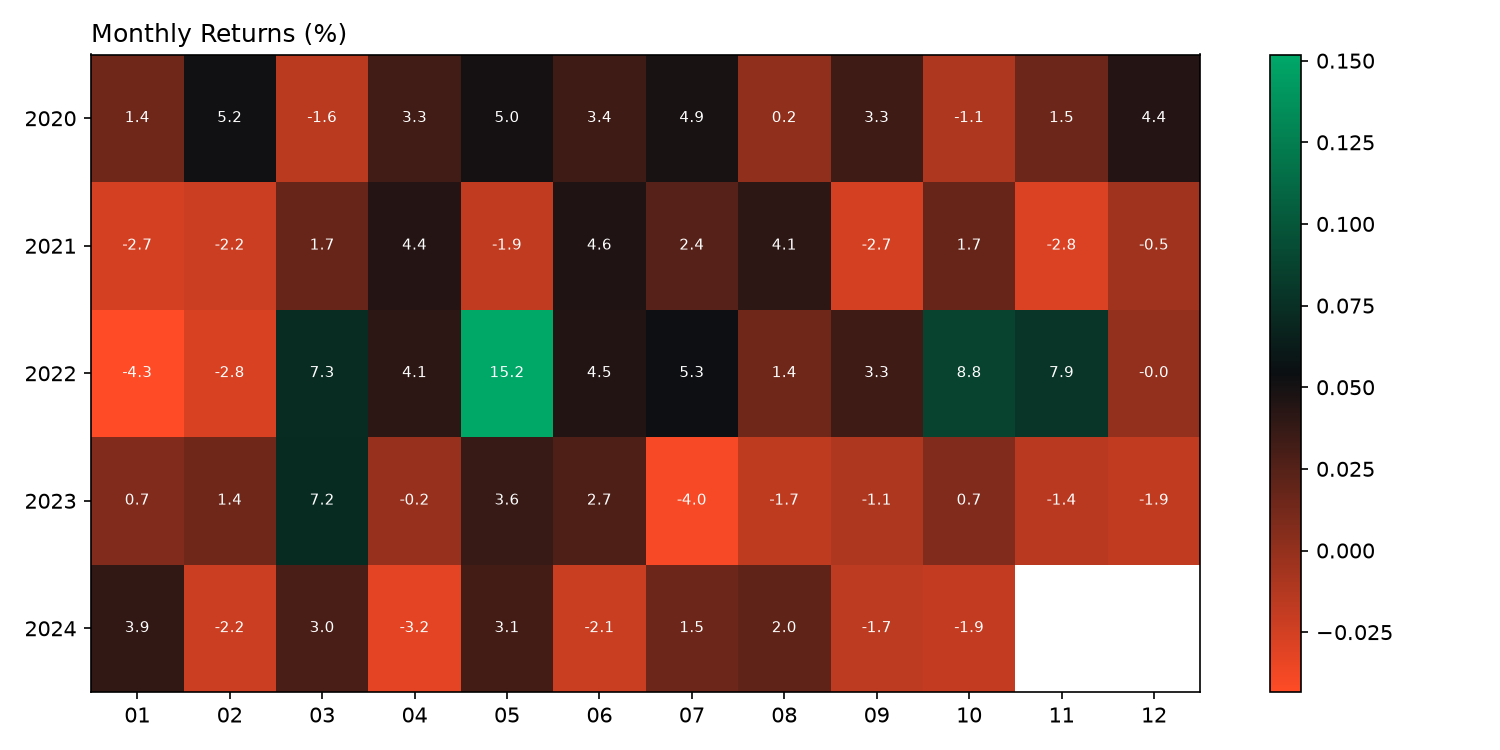
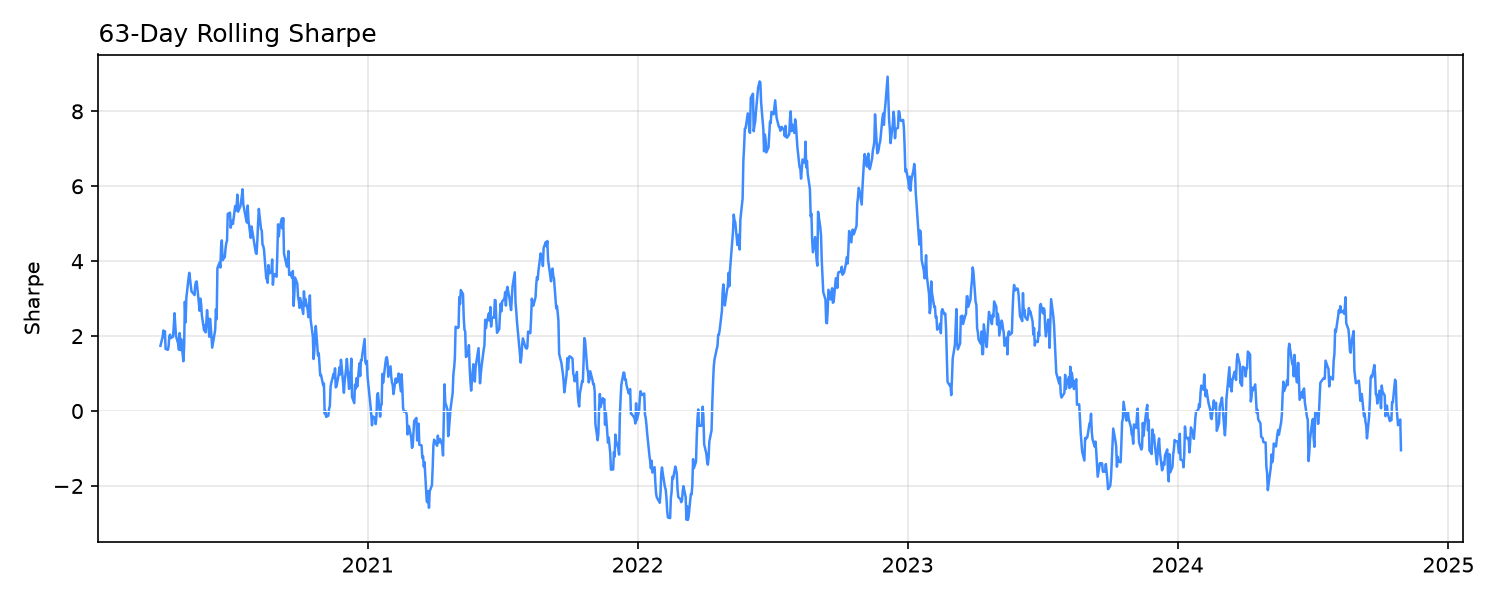
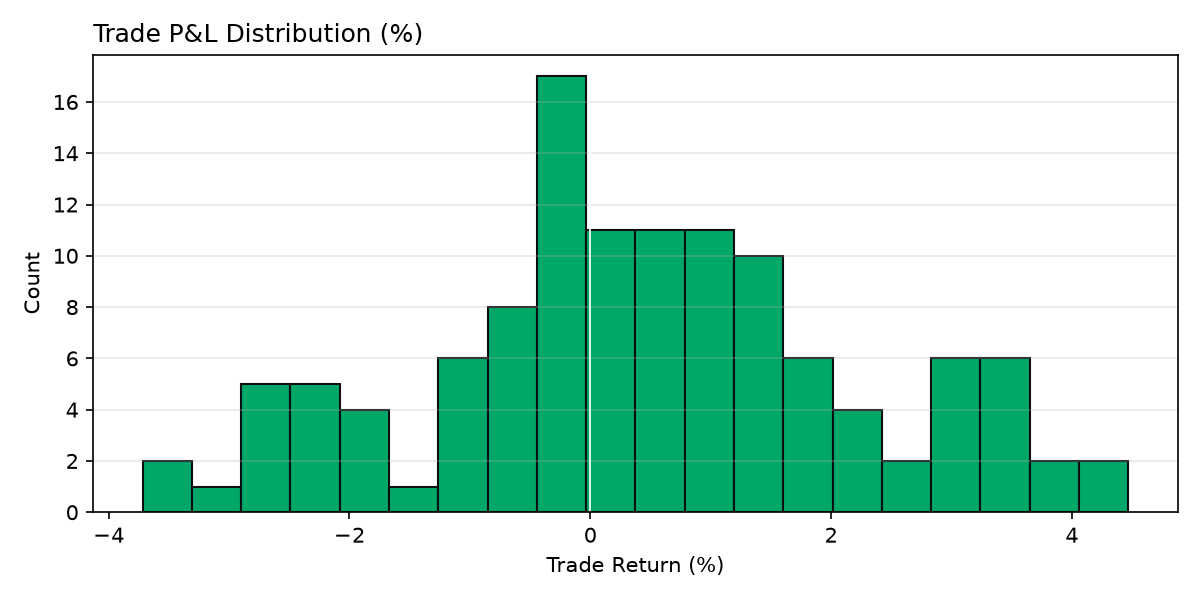
Charts are generated from synthetic strategy returns for demonstration. Replace with live backtest output before investor distribution.